 MathCS.org - Statistics
2.3 Calculations with Spreadsheet Data
Excel can perform a wide variety of operations with the data you entered, but in this course we will only need a small subset of all available functions. This section will explain - very quickly - how to enter some of the more commonly used functions.
There are many different methods in which Excel will let you perform the operations described here; we will usually give only one of the possible methods. If you already know a more efficient way to accomplish the same goal, use your method.
Example: Suppose I want to find the sum and the average of some tabular data, for each row separately.
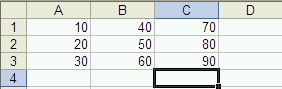
First open Microsoft Excel and enter the data into the spreadsheet, as follows:
To compute the sum of the numbers in column C, proceed as follows (if you follow these instructions slowly and carefully it should work just fine):
- We assume you have entered the number 10 to 90, as shown in the above picture. Now click on the cell C4 which is going to contain the sum of the numbers in the C column.
- Type:
=
to indicate that this cell will contain a formula - After the equal sign, continue to type:
sum(
to specify that you want to use the summation function - make sure to include the open parenthesis ( - Now use the
Up-Arrow
key to move the active cell to C3. Note that C3 will automatically be placed in your function - Hold down the
SHIFT key and press the Up-Arrow twice
Now C1:C3 will be placed in your function - Complete the function by typing
)
(the closing parenthesis) and hit ENTER
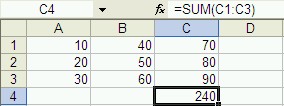
You should now find the sum of the cells C1, C2, and C3 in cell C4. Instead of using the arrow keys in steps 4 and 5 you can also select the cells whose sum you want to find by "dragging" the mouse over them. In other words, you could also:
- Click on the cell C4 which should contain the sum of the numbers in the C column.
- Type:
=
to indicate that this cell will contain a formula - Continue typing:
sum(
to specify that you want to use the summation function - make sure to include the open parenthesis ( - Use the mouse to drag the cursor over the cells from C3 to
C1.
Now C1:C3 will be placed in your function - Complete the function by typing
)
(the closing parenthesis) and hit ENTER
which will accomplish the same task. Now your spreadsheet should look similar to the following:
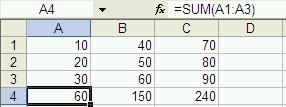
Instead of enter the final two formulas into cells A4 and B4, we can now copy and paste the formula from cell C4. The range of the summation formula will automatically adjust to compute the sums of columns A and B, respectively.
-
Click on cell C4
-
Select "Edit | Copy" or use the Control-C keyboard shortcut
-
Click on cell B4 and select "Edit | Paste", or use the Control-V keyboard shortcut
-
Click on cell A4 and again select "Edit | Paste", or use the Control-V keyboard shortcut
Excel offers many other functions that are interesting for statistical analysis, such as:
- AVERAGE - Returns the average of its arguments
- CHITEST - Returns the test for independence
- CONFIDENCE - Returns the confidence interval for a population mean
- CORREL - Returns the correlation coefficient between two data sets
- COUNT - Counts how many numbers are in the list of arguments
- COVAR - Returns covariance, the average of the products of paired deviations
- FREQUENCY - Returns a frequency distribution as a vertical array
- INTERCEPT - Returns the intercept of the linear regression line
- LARGE - Returns the k-th largest value in a data set
- MAX - Returns the maximum value in a list of arguments
- MEDIAN - Returns the median of the given numbers
- MIN - Returns the minimum value in a list of arguments
- MODE - Returns the most common value in a data set
- NORMDIST - Returns the normal cumulative distribution
- PEARSON - Returns the Pearson product moment correlation coefficient
- PERCENTILE - Returns the k-th percentile of values in a range
- QUARTILE - Returns the quartile of a data set
- RANK - Returns the rank of a number in a list of numbers
- SKEW - Returns the skewness of a distribution
- SLOPE - Returns the slope of the linear regression line
- SMALL - Returns the k-th smallest value in a data set
- STDEV - Estimates standard deviation based on a sample
- TTEST - Returns the probability associated with a Student's t-test
- VAR - Estimates variance based on a sample
- ZTEST - Returns the two-tailed P-value of a z-test
Practice: Compute the average of the numbers in columns A, B, and C (of course do not include the sums in the fourth row in your calculation). Make sure the average for each column is computed below the sum. Then format the sum and average numbers bold and italics.