 MathCS.org - Java
zMap:Screenshots
Here are a few screenshots of ZMap in action. You can click on the Start button to start ZMap (with default parameters) so you could replicate the examples and answer the questions below.
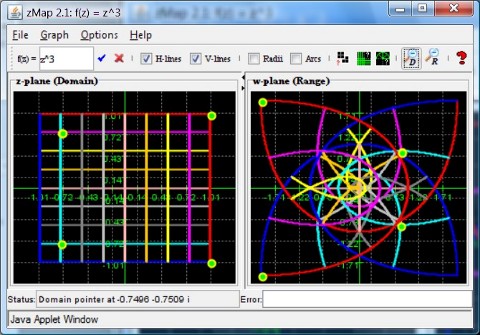 |
Figure 1 shows how the complex function f(z) = z3 transforms horizontal and vertical lines. Four points, shown in green, are also displayed in the domain and their images in the range. You can see, for example, that at each of the green dots the lines meet in a right angle, approximately. That's because this function represents a conformal map, which means that it preserves angles between intersecting curves.
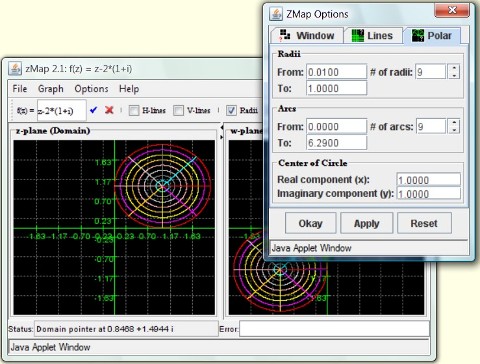 |
Figure 2 shows the linear function f(z) = z - 2*(1+i) applied to a circle shifted up and to the right. You can see that the image of that circle is another circle, same size but this time shifted down and to the left. Can you explain that? You can also see an options dialog, showing the parameters for circular images in the domain.
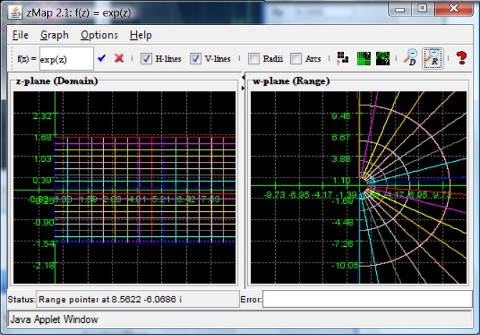 |
This time the mapping properties of f(z) = ez are shown. You can see that the infinite strip with real part of z greater than zero and imaginary part between -π/2 and π/2 is mapped to the entire right-half plane (or so it seems, it's not the entire right-half plane) - make sure to explain it. Try to determine what would happen to the strip with π/2 < Re(z) < 3 π/2.
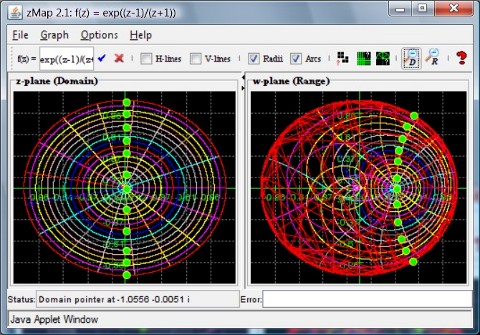 |
Here in Figure 4 you can see that f(z) = e(z-1)/(z+1) apparently maps the unit circle onto itself, so it is a surjective map from the unit disk to itself. Do you think it is also injective, i.e. one-to-one (if it was, it would be a bijection and would be called a Riemann Map)? By following the green dots in domain and range you can also see that the imaginary axis is mapped to an arc. What is, in particular, the image of z = 0? What would the image of z = 1 and z = -1 be?
 |
 |
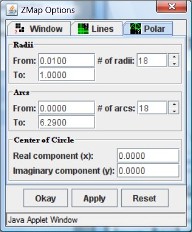 |
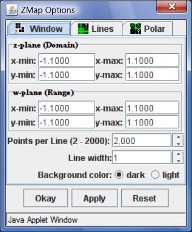
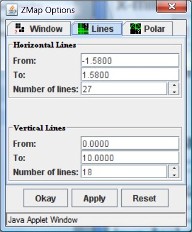
| Fig 5a: Global options | Fig 5b: Line options | Fig 5c: Polar options |
The final screenshot in figure 5 shows the various options that are available to fine-tune the appearance of domain and range. You can define the size of domain and range and the overall look of the curves in "global" options (figure 5a). Under "line" options you can adjust parameters for horizontal and vertical lines (figure 5b) and the "polar" options allow you to adjust how circles look (figure 5c). For details, please refer to the "help" feature of ZMap.