zMap: Mathematical Background
A complex number z is a linear combination of two real numbers x and y together with a symbol i defined via the property that i2 = -1 as follows:
z = x + i y, where i is a symbol such that i2 = -1 and x, y are real numbers
The variable x is called the real part of z, or
Re(z) = x, while y is called the imaginary part, or
Im(z) = y. The constant i is the imaginary unit, defined by
the property that i2 = -1 (which makes it non-real or
imaginary - you can not find it on the usual number line). Informally you can
think of i as the square root of -1, i.e. i =  = (-1)1/2.
Please note that - contrary to what you might think - the imaginary part of a complex number is a real number (confusing, isn't it). The real part is also a real number, but that "sounds" right. In other words, if z = 2 + 3 i, then Re(z) = 2 and Im(z) = 3.
Complex numbers can be added, subtracted, multiplied, and divided using rules familiar from the real numbers together with that fact that i2 = -1. For example:
or
or
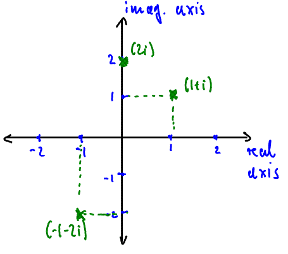
Since real and imaginary parts of a complex number are independent of each other, the space of all complex numbers is two-dimensional. It can be visualized as a plane with a horizontal (the real) and vertical (the imaginary) axis. For example, the complex numbers
A = 1 + i, B = -1 - 2 i, and C = 2 i
are as shown in figure 1

Figure 1: The complex plane with a few points marked
But then a function that takes complex numbers as input and produces (possibly) complex values as output is a map from two-dimensional space (the domain) to another two-dimensional space (the range).
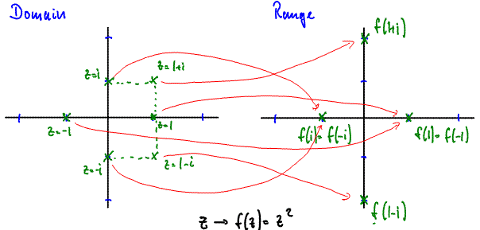
Example: Let's consider the (complex) square function f(z) = z2. We can easily generate a table of input/output values, as shown below. You can see, for example, that the function f maps -1 to 1, 1+i to 2i and so on. We can visualize this mapping property by drawing the domain in one coordinate system, say on the left, and the range in a second coordinate system next to the domain. Then we plot the points in the domain and their corresponding images in the range (see figure 2).

Figure 2:Domain and Range with points and images |
|
To go one step further, we draw complete curves - not only single points - in the coordinate system representing the domain and see what the map does to this collection of points by drawing their images in another coordinate system on the right.
Example: Let's again consider the (complex) square function f(z) = z2. This time we want to see what that function does to a horizontal (say) line going through the point z = i.
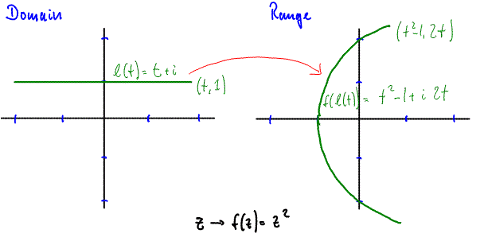
Answer: A horizontal line passing through the point z = i has as imaginary part (or height) always 1, whereas the real part is arbitrary, since the line stretches from left to right infinitely long. Therefore, a (parametric) equation of such a line is given by l(t) = t + i, where t is a real number. To find the image of this line, we substitute its equation into the function. We get:
f(l(t)) = f(t + i) = (t+i)2 = (t+i) (t+i) = t2 - 1 + 2 i t
But t2 - 1 + 2 i t is equivalent to the parametric curve (t2 - 1, 2t), splitting up the complex result into its real and imaginary parts. But then we have:
x = t2 - 1 and y = 2t
Solving the second equation for t we get y/2 = t. We can substitute that into the first equation to get x = 1/4 y2 - 1. We recognize that as the equation of a parabola going left to right, opening to the right, with vertex at (-1, 0), and with y-intercepts (0,-2) and (0,2). Figure 3 shows the result:

Figure 3: f(z) = z2 maps the horizontal line through z = i to a left-to-right parabola with vertex at w = -1
This is exactly what ZMap does: you define a function as well as curves in
the domain and ZMap will show you the image of the curves in the range. Below is
the ZMap program, showing again what f(z) = z2 will do to the
horizontal line z = l(t) = t+i. For more information on how to use ZMap,
please see the quick guide or
features page, or click on the Help icon ![]() of
the ZMap program below.
of
the ZMap program below.
The ZMap program for f(z) = z2
This idea of drawing domain and range separately next to each other to visualize the graph of a complex function is useful but not entirely enlightening. To understand the limitations of this approach, ask yourself how the "graph" of a regular real function, such as for example f(x) = x2 would look if we drew (real) domain and (real) range next to each other?
We would draw one real line as the domain, and next it another real line as the range. As x moves from -infinity to +infinity, covering the entire domain line, the range would go from +infinity (since negative squared is positive) down to 0 and then back to +infinity. The end result, show in figure 4, would look nothing like the usual parabola we normally visualize with the function f(x) = x2.

Figure 4: Visualizing f(x) = x2 using two number lines</>
Only when we combine domain and range axis at right angles into our usual Cartesian coordinate system do we see how x and f(x) move together to give our true parabola graph. Thus, to get a perfect picture of a graph of a complex function we really should combine the domain coordinate system at right angles with the range coordinate system instead of drawing them next to each other. That, however, would require a 4-dimensional coordinate system. Mathematically, the graph of a complex function is indeed a 4-dimensional object, but since we can not visualize 4-dimensional space we can not use this approach as visualization help.
For more information about complex numbers, please visit Wikipedia or MathWorld.
 MathCS.org - Java


