 MathCS.org - Statistics
back | next
5.1 Frequency Histograms for Categorical Variables
Often one would like to know the frequency of occurrence of values for a variable in percent. This is similar to a frequency histogram or table we studied earlier, but a frequency histogram only applies to numerical variables, while the procedure outlines in this section will apply to categorical variables, much like we did in section 3.6 (there we were interested in charts, now we want percentages).
Thus, this chapter re-introduces the Pivot Table tool we already saw in chapter 3.6. This time we will add some more details, but a potion of the section is as before so you might want to review section 3.6. before reading on.
Example: A survey was conducted, asking 474 randomly selected people for their income level. Display a percentage table for the frequencies for all income levels. In other words, compute, in percentage, how many of the 474 people fall in income level 1, how many in income level 2, etc.
As usual, Excel will be just the tool for this job. Load the following spreadsheet into Excel containing the results of this survey:
After loading this data we see that there is one column of interest, entitled "Salary Level". However, that column represents a categorical variable (ordinal or nominal?) so we can not compute a frequency histogram. So, we need to learn a new procedure for handling categorical data.
The appropriate tool to create percentage tables for category data is the "Pivot Table ...". Actually, the PivotTable is more flexible than we will need in our course, but it will for sure create the type of tables that we will be interested in. We have, of course, already seen the Pivot table (and chart) tool in 3.6, but now we'll explore a few more options. And, we will, in fact, see that tool again in the next section(s).
The Pivot tool is found as the first button of the "Insert" ribbon: load the above spreadsheet into Excel. Select "PivotTable ..." from the "Insert" ribbon and select the entire data set, all columns and rows.
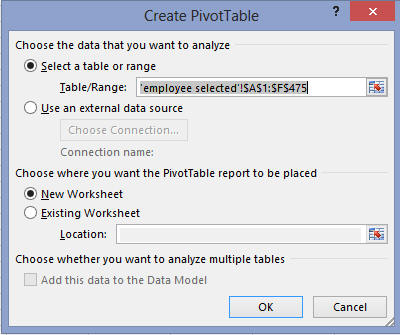
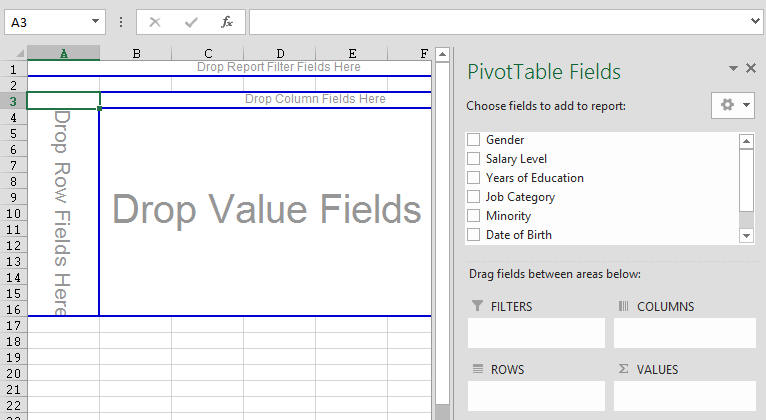
You will see a "potential frequency/percentage table" in a new worksheet, containing labels such as "Drop Row Field Here", "Drop Column Fields Here", etc. There will also be an area for the available variables, in our case "Gender", "Salary Level", "Years of Education", etc. You can "drag-and-drop" these variables to the various slots in the table to create a variety of useful tables for data analysis, or you can drop them into the slots labeld "Columns", "Rows", or "Values" (or, if you want to try, "Filters").
First drag the variable "Salary Level" from the Pivot Fields into the "Drop Row Fields" area of the table. Your table will adjust, showing you all available salary levels. Next, again drag the variable "Salary Level" again, but this time drag it to the "Drop Data Item" area in the middle (or to the "Values" area on the right. You will then see the counts of how many occurrences fell inside each salary level, similar to the following:
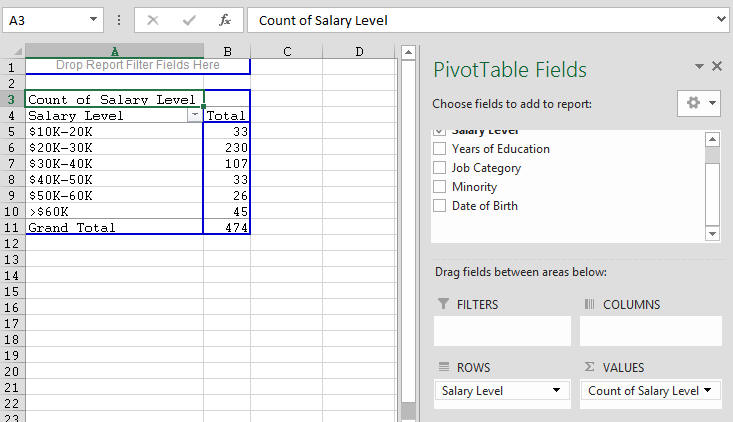
Note that your picture might look slightly different. Make sure, though, that you see two "buttons", one called "Salary Level" (which applies to the first column) and "Count of Salary Level" (which should apply to the second column). We see, for example, that there were 33 people in the salary range of $10K to 20K, 230 in the next salary range, and so forth. Of course raw numbers are not so useful, so we would like to convert them to percentages.
You can adjust what exactly is shown in the "data" area of your table by double-clicking the link entitled "Count of Salary Level" that you see above -Note that you do need to double-click "Count of Salary Level", not "Salary Level". You will see the following dialog:
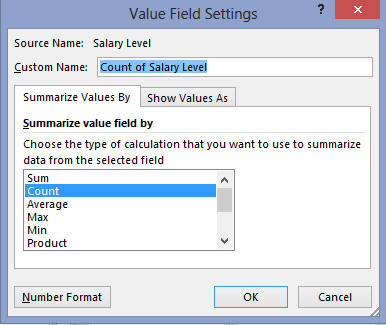
Here you can specify what computation you want to show in the data area of your table. In most cases, Count is the preferred selection, but you do need to change the format for the count. Click the "Show Values as" tab and select "% of Column Total", as shown:
Hit OK and you should see our complete frequency chart for the ordinal variable "salary level":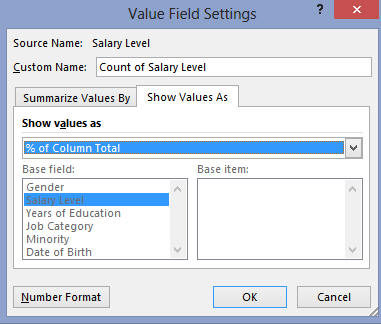
From the table we can see, for example, that 6.96% + 48.52% = 55.48% of employees earn $30,000 or less.
Example: Use the same Excel data set to find the percentage of males and females that took part in this survey, as well as the percentage of the various job categories.
The procedure is similar to above:
- Choose to insert a new "PivotTable ..."
- Select the appropriate column as input
- Put that variable in the "row" as well as the "data" field of the table in the wizzard's dialog box
- Choose the "% of Column Total" option for the "data"
- "Finish" the tables
Here are the resulting tables so that you can check your own results:
-
Percentages of male/females in the survey
-
Percentages of job categories in the survey
Note: Once you have such a table - Excel calls it a Pivot Table - you can change the categories (variables) to be displayed by dragging them in and out of the table. Maybe you could try to experiment to create a percentage table relating salary level with gender (sex), i.e. work with two variables simultaneously.